WILD CARD OF GOLD
FLOW CYTOMETRY
Wild Card of Gold: FLOW CYTOMETRY, a fast, powerful and versatile technique at the service of neuroscience
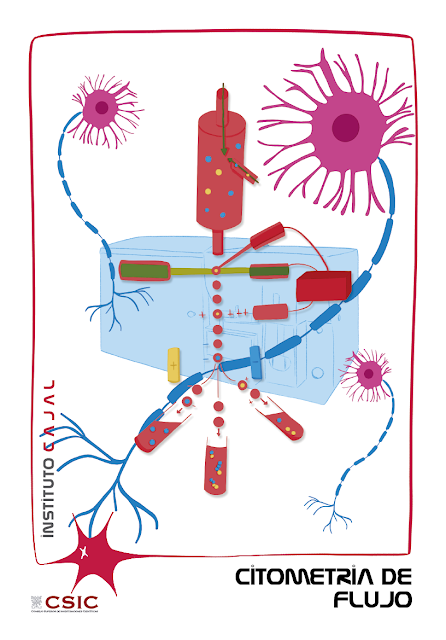
FLOW CYTOMETRY is worth its weight in gold because it allows the cells present in a sample to be analyzed very quickly (one million cells in about 10 minutes😮). In addition to counting them, it allows us to know a series of characteristics related to the size and internal complexity of each one of them. Due to the number of applications it has in the field of neuroscience, the flow cytometer is essential equipment to continue advancing our knowledge of the nervous system.
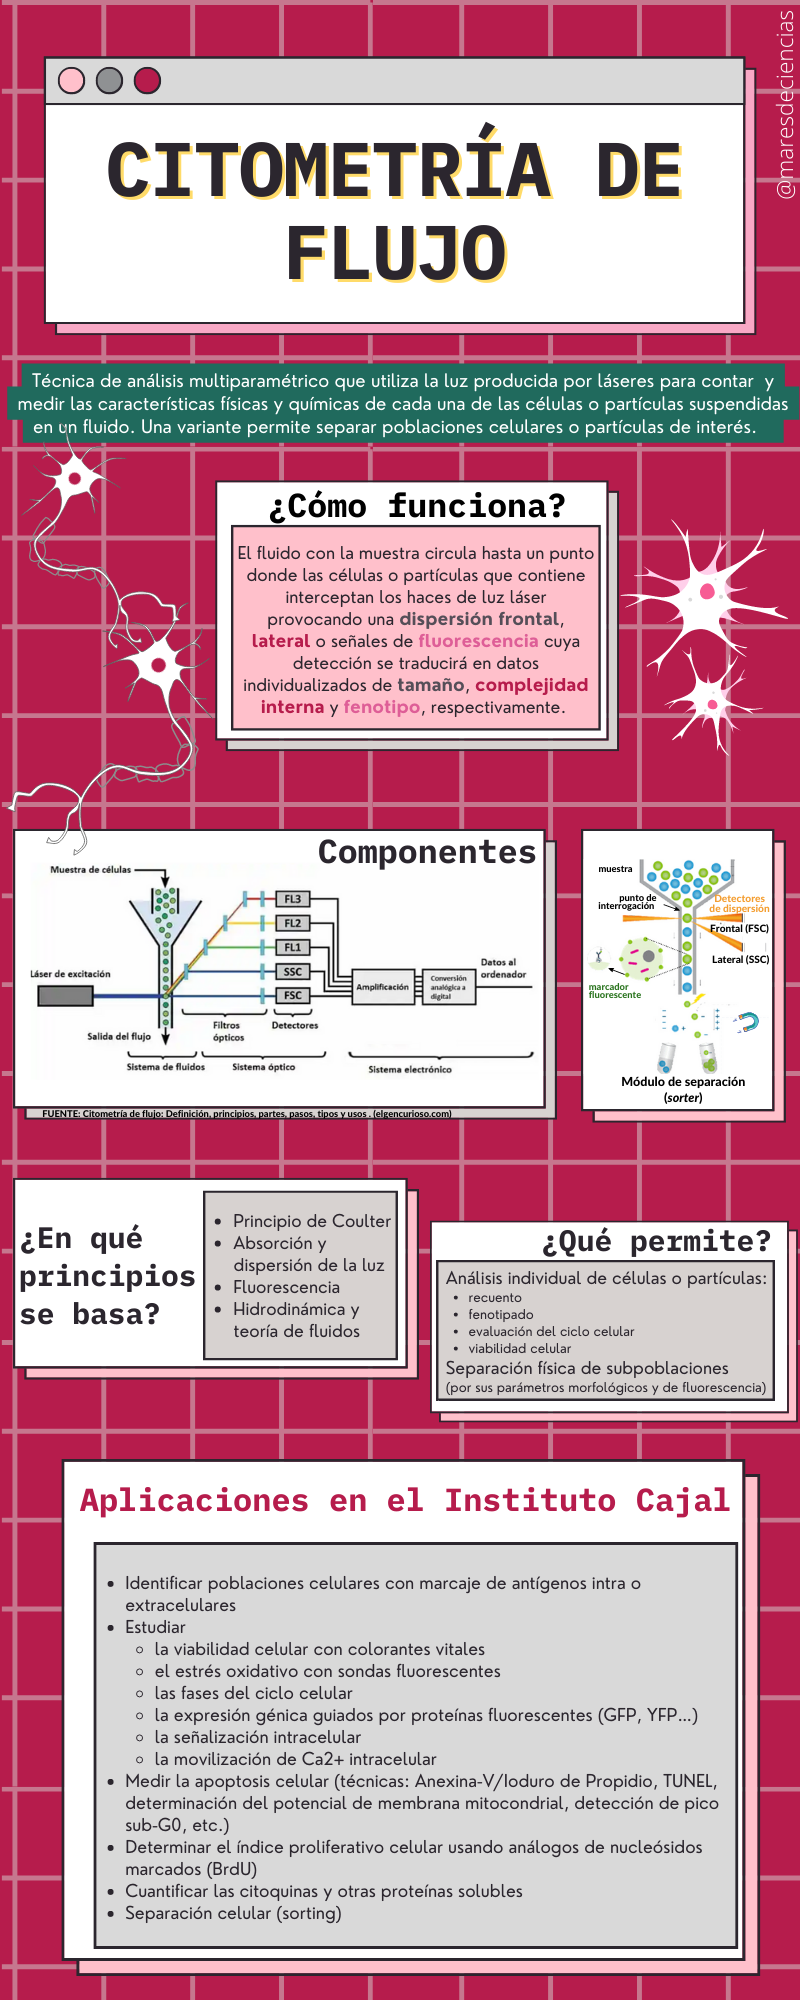
The flow cytometer is one of the star pieces of equipment in any neuroscience laboratory, because it incorporates technology that allows it to measure and quantify phenotypic, biochemical or molecular properties of both individual cells and other particles, biological or not. A common variant of this technique also allows cells or particles to be physically separated according to their properties, allowing, for example, to purify populations of interest.
Despite its name (in Greek kytos means “cell”), the flow cytometer is not only used to analyze cells, but it can also analyze chromosomes, molecules or any other particle that is suspended in a liquid and within the size range cell (approximately between 0.15 and 120 micrometers [1]).
Flow cytometry is a technology:
- Very fast: analyzes and counts tens of thousands of cells or particles in a few seconds (an average of more than 2000 per second [2]).
- Very powerful: it simultaneously analyzes more than a dozen qualitative and quantitative parameters (intrinsic and extrinsic [3]) of each of the cells or particles present in a heterogeneous cell population. e any cell or suspended particle from 0.2 to 150 microns
- Very versatile: in addition to counting cells, it allows obtaining information related to the size and internal complexity of each cell. Using antibodies with a fluorescent marker, the degree of expression of certain cell surface proteins is also known.
- Like any cutting-edge technique, flow cytometry requires highly qualified personnel to handle it and has a high cost, both in terms of pretreatment, staining and sample preparation, as well as calibration.
A little history
Considering that flow cytometry is a complex technology that is based on the combination of different physical, chemical, electrical and optical principles, it is difficult to establish its starting point. However, the first prototype of a flow cytometer is considered to be the photoelectric device designed in 1934 by bacteriologist Andrew Moldovan to count individual cells moving through an illuminated capillary tube placed on a microscope stage. Although the design was published in Science magazine, the device was never built.
During World War II, the US military’s interest in developing a system that would rapidly detect bacterial biological agents marked another important milestone in the history of flow cytometry. It was Gucker and O’Konsi who, in 1947, developed the first cytometer for the detection of bacteria and spores in aerosols using a Ford headlight as an illumination source and a photomultiplier tube to amplify the incandescent light signal.
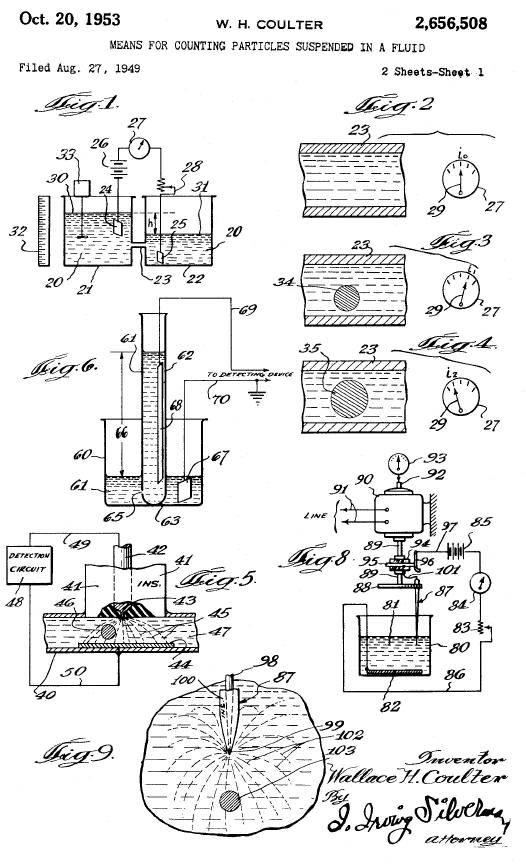
Some years later, in 1953, electrical engineer Wallace H. Coulter stated the so-called “Coulter principle”, which states that particles passing through an orifice in the presence of an electric current produce a change in impedance. which is proportional to the volume of the particle.
Mack Fulwyler invented the first cell sorter in 1963 at Los Alamos National Laboratory (USA) by combining automated cell size analysis with new inkjet jet printer technology.
In 1967, Louis Kametsky (IBM) designed a spectrophotometric device to classify cervical cells based on multiple spectrophotometric properties at speeds greater than 500 cells per second (current cytometers can work at speeds of 70,000 events per second).
In 1978, Wolfgang Göde developed the first fluorescence-based flow cytometer at the University of Münster (Germany). In the early 1970s, Howard Shapiro and Block Instruments designed a series of flow cytometers with a multibeam laser system that allowed multiple fluorescences to be measured simultaneously. Shapiro published what remains one of the “bibles” of cytometry: “Practical Flow Cytometry.”
In parallel, a group at Stanford University (USA) led by Len Herzenberg developed and patented the first fluorescence-activated separator cytometer (FACS) in the late 1960s. This new method for separating individual cells based on of its specific light scattering and fluorescence characteristics revolutionized research in immunology, hematology and oncology.
In 1974 Becton Dickinson (now BD Biosciences) licensed FACS technology from Stanford University and introduced the first commercial FACS cytometer.
We cannot forget what the work of George Köhler and César Milstein meant for the exponential development of flow cytometry in biomedical research, who in 1975 fused lymphocytes with myeloma cells for the first time to obtain a hybridoma, an immortal cell line capable of to produce specific antibodies (monoclonal). A work for which they received the Nobel Prize in Physiology and Medicine in 1984, together with Niels K. Jerne.
Operating principles
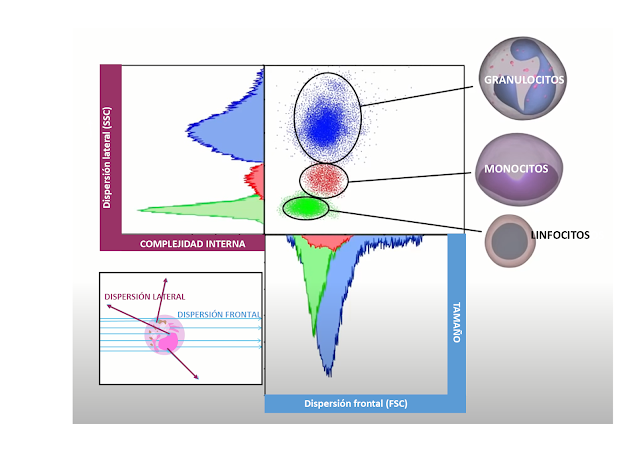
Basically, the flow cytometer measures the absorption and scattering properties of light by the cell or subcellular particle, as well as the fluorescence emitted by fluorochromes bound to cellular components of interest, and induced by appropriate illumination. The greater or lesser dispersion of light according to different angles allows the relative size and complexity (surface morphology, internal granularity) of the cell to be quantified.
The fluid theory is the basis for the hydrodynamic system that creates the laminar flow that forces the cells or particles to flow in a single file in the center of the current (hydrodynamic approach) until leading them to the question point, where the laser will excite to generate a variety of excitation potentials.
At the question point, the counting of cells or particles is based on the aforementioned Coulter principle.
Basic components of a flow cytometer
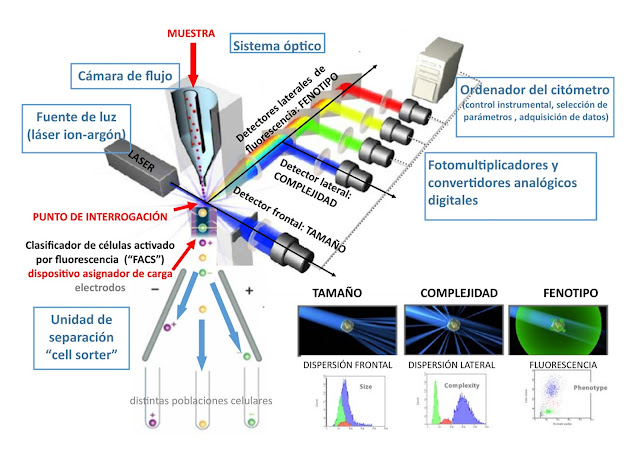
Some cytometers incorporate a separation unit (or cell sorter module), so that in addition to analyzing cells, they allow subpopulations of a sample to be physically separated based on their morphological and fluorescence parameters. Sometimes the separation is immunomagnetic (magnetizable microspheres are coated with monoclonal antibodies that mark the cells to be analyzed).
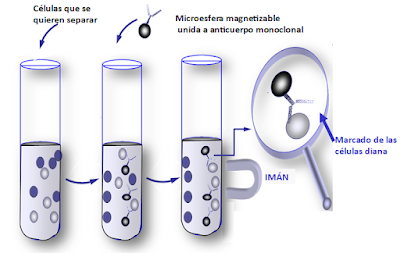
Immunomagnetic separation (adapted from immunosalud.net)
At the Cajal Institute, this allows us, for example, to separate the neurons that express orexin from the hippocampus of a mouse in a tube, isolating them from the rest of the cells in the animal’s brain. This, together with the development of omics sciences and “single cell” studies, make the separation module and specifically single cell technology a cutting-edge application within the field of neuroscience.
The OPTICAL SYSTEM illuminates the cells or particles and thanks to the set of filters and mirrors the emitted light reaches the detectors. The light source is usually a laser beam (highly directed, monochromatic, coherent, intense light that is concentrated into a narrow beam). Currently it is usually an argon ion laser. The excitation optical system is completed with lenses, mirrors and filters that focus the light beam to illuminate the sample and decompose the fluorescence emission into its individual components.
The ELECTRONIC SYSTEM is responsible for recording and processing information thanks to a series of photomultipliers and analog/digital converters that detect and convert light signals into electrical impulses, and these into digital signals. A computer ensures the instrumental control of the flow cytometer and the storage and analysis of the data in real time or in data matrix mode.
The data generated by flow cytometers can be represented in relation to a variable, in the form of a histogram, or in two-dimensional dot-plots and two or more variables, or even in three-dimensional graphs.
Future perspectives
SPECTRAL FLOW CYTOMETRY
Instead of evaluating the maximum emission of each fluorophore, spectral flow cytometry uses an array of detectors to measure the entire spectrum, which is then separated using a mathematical algorithm. This allows the use of fluorophores with very similar, almost overlapping spectra to increase the number of parameters analyzed in each experiment.
CLASSICAL POLYCHROMATIC CYTOMETRY
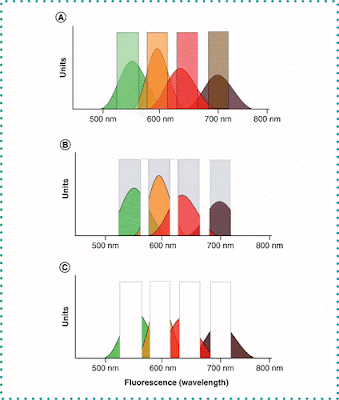
MASS CYTOMETRY
It is a combination of flow cytometry with mass spectrometry. Instead of antibodies labeled with fluorophores, this technique uses antibodies labeled with heavy metal ions.
IMAGING CYTOMETRY
This technique combines cytometry with fluorescence microscopy and allows the evaluation of cell morphology (it is one of the great limitations of classical cytometry) and also allows visualization of protein co-expression, cell attachment, cellular translocation of proteins, immune cell synapses…As the image shows, by simply passing the blood through the cytometer—without using fluorescent markers—we can differentiate between lymphocytes, monocytes and granulocytes by analyzing their size and complexity.
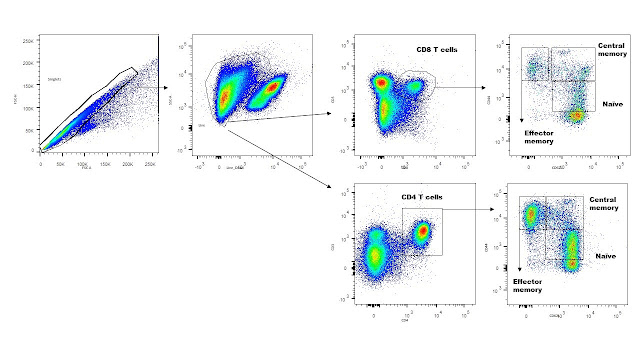
Gating strategy to analyze the proportion of memory effector CD8 lymphocytes in relation to other lymphocyte subpopulations in the mouse brain.
Applications of flow cytometry
- IMMUNOPHENOTYPING = identifying and quantifying different cell populations according to the different expression of certain surface or intracellular markers
- Application in cancer diagnosis and treatment
Diagnosis and monitoring of immunodeficiencies (for example HIV patients)
Cell therapy and transplant (compatibility studies to choose the right donor) - MEASUREMENT OF CELL VIABILITY = differentiating live cells from dead cells.
- ANALYSIS OF CELLULAR ACTIVITY
- Measurement of the phagocytic capacity of a cell
- Measurement of apoptosis (= programmed cell death of the cell that plays an important role in cancer prevention)
- Determination of calcium mobilization
- Determination of reactive oxygen species
- CELL PROLIFERATION ASSAYS = allow active cells to be differentiated from resting cells
- STUDY OF THE CELL CYCLE = the fluorescent labeling of the DNA allows us to establish which phase of the replication cycle the cell is in
- ESTIMATION OF GENOME SIZE (set of genes)
- CELL SEPARATION = Separating flow cytometers use electrostatic properties to separate the cells of interest present in the sample by type.
- IDENTIFICATION AND COUNTING OF BACTERIA
What do we do in the Cytometry Unit of the Cajal Institute?
- Identify cell populations by labeling intra- or extracellular antigens
- Study cell viability through the use of vital dyes
- Measure cell apoptosis using different techniques (Annexin-V/Propidium Iodide, TUNEL, determination of mitochondrial membrane potential, sub-G0 peak detection, etc.)
- Study oxidative stress using fluorescent probes
Study the different phases of the cell cycle - Determine the cell proliferative index by using labeled nucleoside analogues (BrdU)
- Study gene expression guided by fluorescent proteins (GFP, YFP…)
- Study intracellular signaling
- Quantify cytokines and other soluble proteins
- Study intracellular Ca2+ mobilization
- Cell separation (sorting)
You see, flow cytometry has a future as bright as the gold suit it represents, mainly because it is the only technology that allows global and multiparametric analyzes of individual cells.
Have you been curious and want to know more?
Grades:
[1] The Cajal Institute flow cytometer analyzes cells or particles between 0.5 and 100 micrometers.
[2] Wikipedia, entry Flow cytometry https://es.wikipedia.org/wiki/Citometr%C3%ADa_de_flow
[3] Intrinsic parameters, such as size, surface, granularity of the cell interior, autofluorescence (an intrinsic property of certain molecules—called fluorophores—that are characterized by the transient emission of light when stimulated by an exogenous source of a length of shorter wave (more energetic).
Extrinsic parameters, such as content and composition of nucleic acids (DNA and RNA), chromatin structure, proteins, sulfhydric groups (-SH), antigens, lectins, binding sites, cytoskeletal components, membrane structure, enzymatic activity , endocytosis, surface charge, receptors, free and bound calcium, apoptosis, cell necrosis, pH, pharmacokinetics.
Other sources:
PAUL ROBINSON, J. (2022). Flow cytometry: past and future. Biotechniques Vol. 72, no. 4
https://www.future-science.com/doi/10.2144/btn-2022-0005
The curious gene. Input Flow cytometry. https://www.elgencurioso.com/diccionario/citometria-de-flujo/
https://www.ncbi.nlm.nih.gov/pmc/articles/PMC3279584/
http://www.cyto.purdue.edu/
Videos:
Flow Cytometry Animation (IN ENGLISH), MIT https://www.youtube.com/watch?v=EQXPJ7eeesQ
Rodrigo Blanco and Dr. Corell Almuzara for the Faculty of Medicine of the University of Valladolid https://www.youtube.com/watch?v=gEdZvuDrWo4
Paula Reyes https://www.youtube.com/watch?v=RfDMmxS8Zik
Malte Paulsen, Flow Cytometry introduction https://www.youtube.com/watch?v=W1BFeiDwqnk
